


Free BBT Chart: How to Track and Interpret Ovulation for Fertility
If you’re not sure whether you’re ovulating, basal body temperature (BBT) is one of the simplest ways to start getting answers.
But most women either track it incorrectly, or don’t know what their chart is actually telling them.
Here’s how to track and interpret
BBT charts the right way.
What is Basal Body Temperature?
Basal body temperature is your body’s temperature when you’re fully at rest.
If you’re trying to conceive, or you just want to understand your hormone health, BBT charting is helpful because it shows you when you ovulated.
Fertility Awareness-Based Methods (FABMs) include tracking your BBT because it can help you determine when you’re fertile.
(Note: BBT can be used to confirm ovulation after it happens. It does not predict ovulation.)
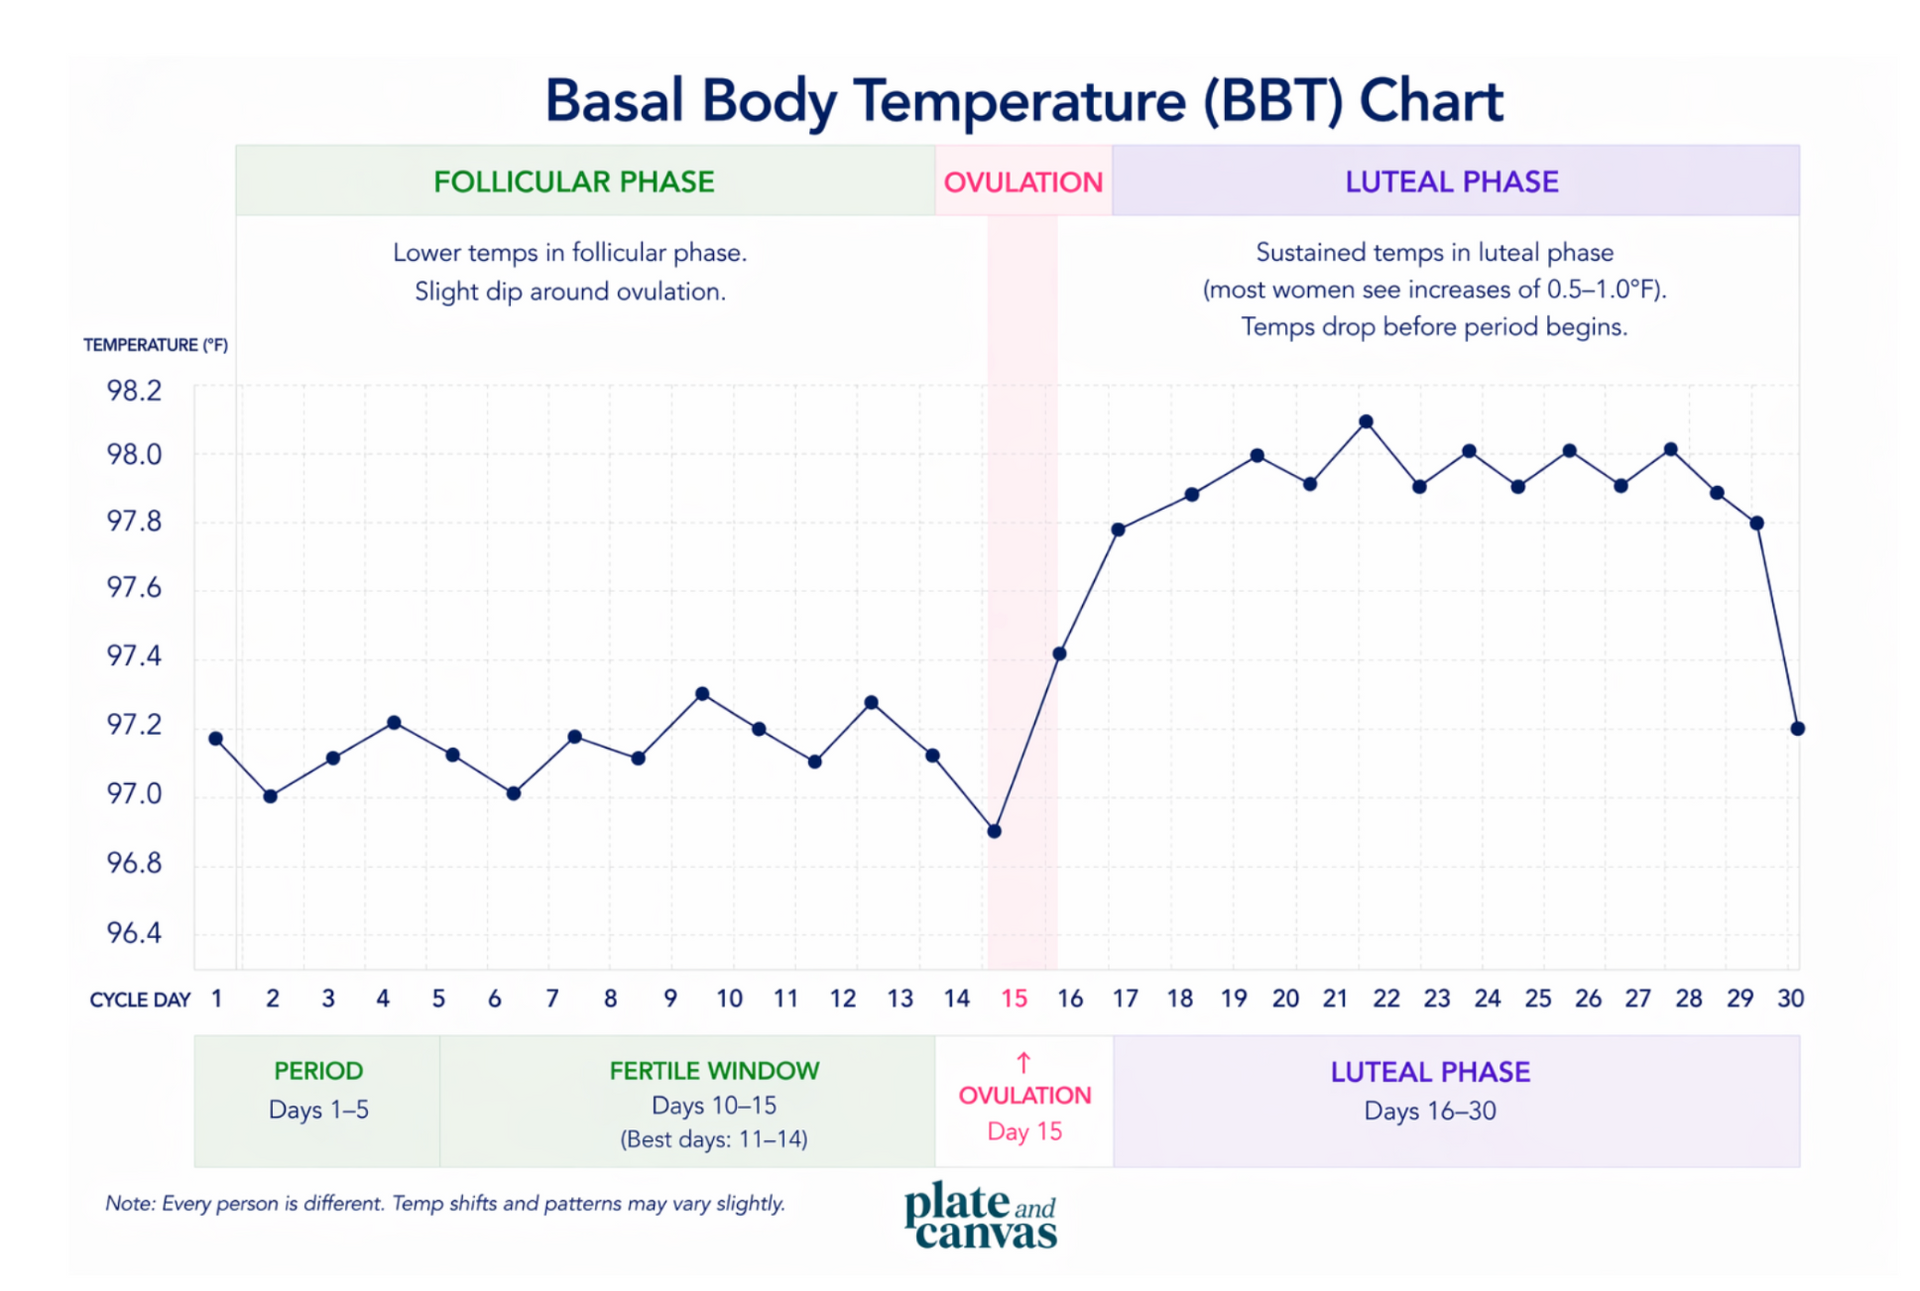
On a BBT chart, this shows up as:
- Lower temperatures before ovulation (because of higher estrogen levels)
- A sustained temperature rise after ovulation (from higher progesterone levels)
- Elevated temperatures until your period (when progesterone levels drop)
By taking your basal body temperature every day and observing patterns, you can:
- Discover if/when you’re ovulating
- See the length of your follicular and luteal phases
- Pick up on potential hormonal issues like short luteal phase and progesterone insufficiency

How to Take Basal Body Temperature Correctly
If you want accurate data, consistency matters.
Here’s exactly how to take your basal body temperature so your chart reflects what’s actually happening.
1. Use a True Basal Thermometer
Choose a thermometer that measures to two decimal places (for example, 97.36°F). Standard thermometers are not precise enough.
2. Take It Immediately Upon Waking
Even small movements can raise temperature. Make sure you take your temperature right when you wake up, while you’re still in bed. Avoid sitting up, talking, drinking water, even checking your phone.
3. Take It at the Same Time Daily
Aim for the same 30–60 minute window each morning. Sleeping in or waking up much earlier can shift readings.
4. Five minute rule
For the most accurate reading, place the thermometer in your mouth and let it sit for about five minutes before pressing start.
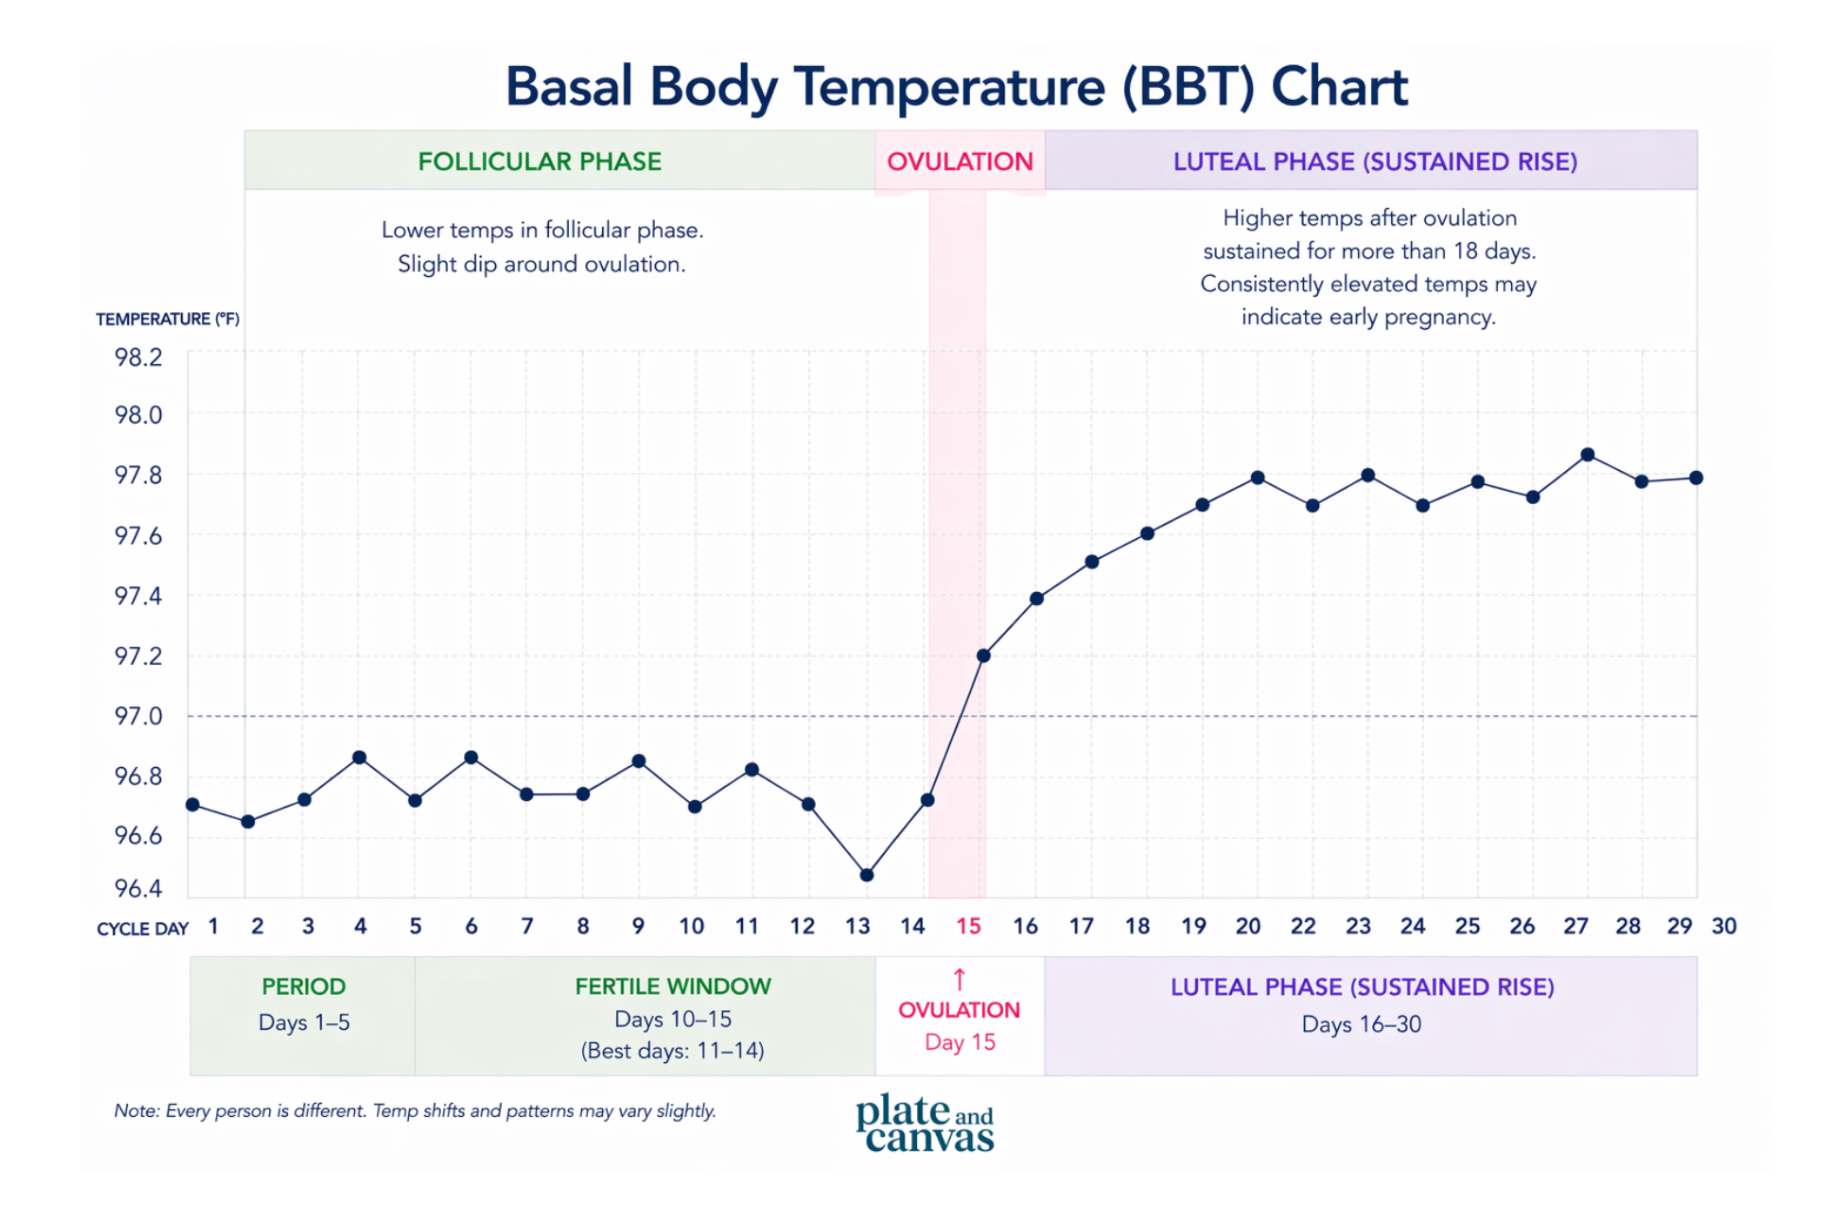
What a Normal BBT Chart Looks Like
A “normal” BBT chart will show:
- Lower temperatures during the follicular phase
- A noticeable temperature increase (0.4-1.0°F) after ovulation
- An increase sustained for at least 3 consecutive days
- A luteal phase lasting 11–14 days
Example Pattern
- Follicular phase: 97.0–97.4°F
- Ovulation shift: rise to 97.8–98.3°F
- Luteal phase: sustained elevated temps
The numbers matter less than the pattern - you’re looking for a clear, sustained shift.
Common BBT Patterns and What They Mean
Certain patterns can give clues about what’s happening hormonally, but keep in mind they’re not diagnostic on their own.
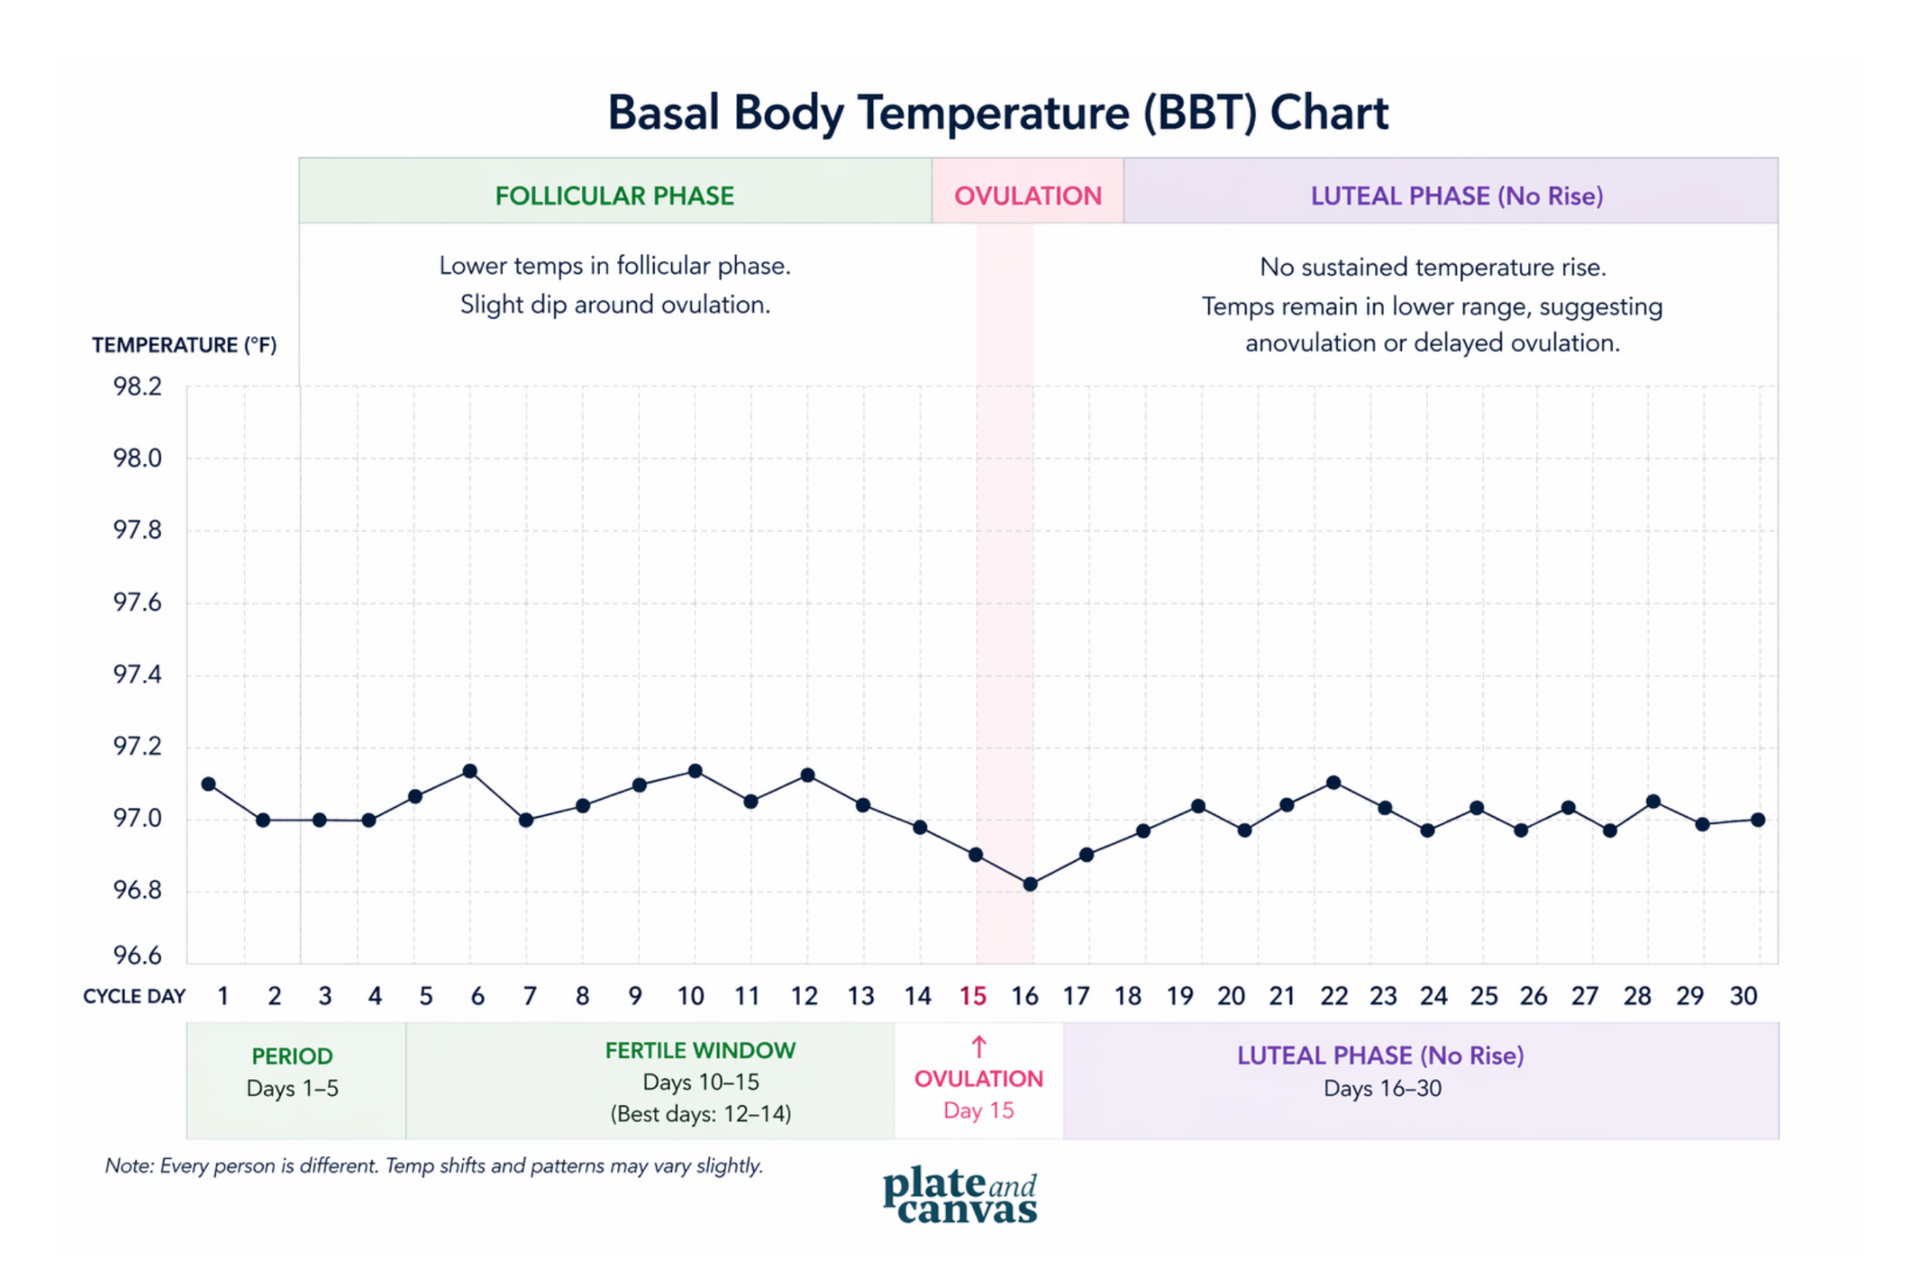
No Temperature Rise
Suggests anovulation (no ovulation) or delayed ovulation.
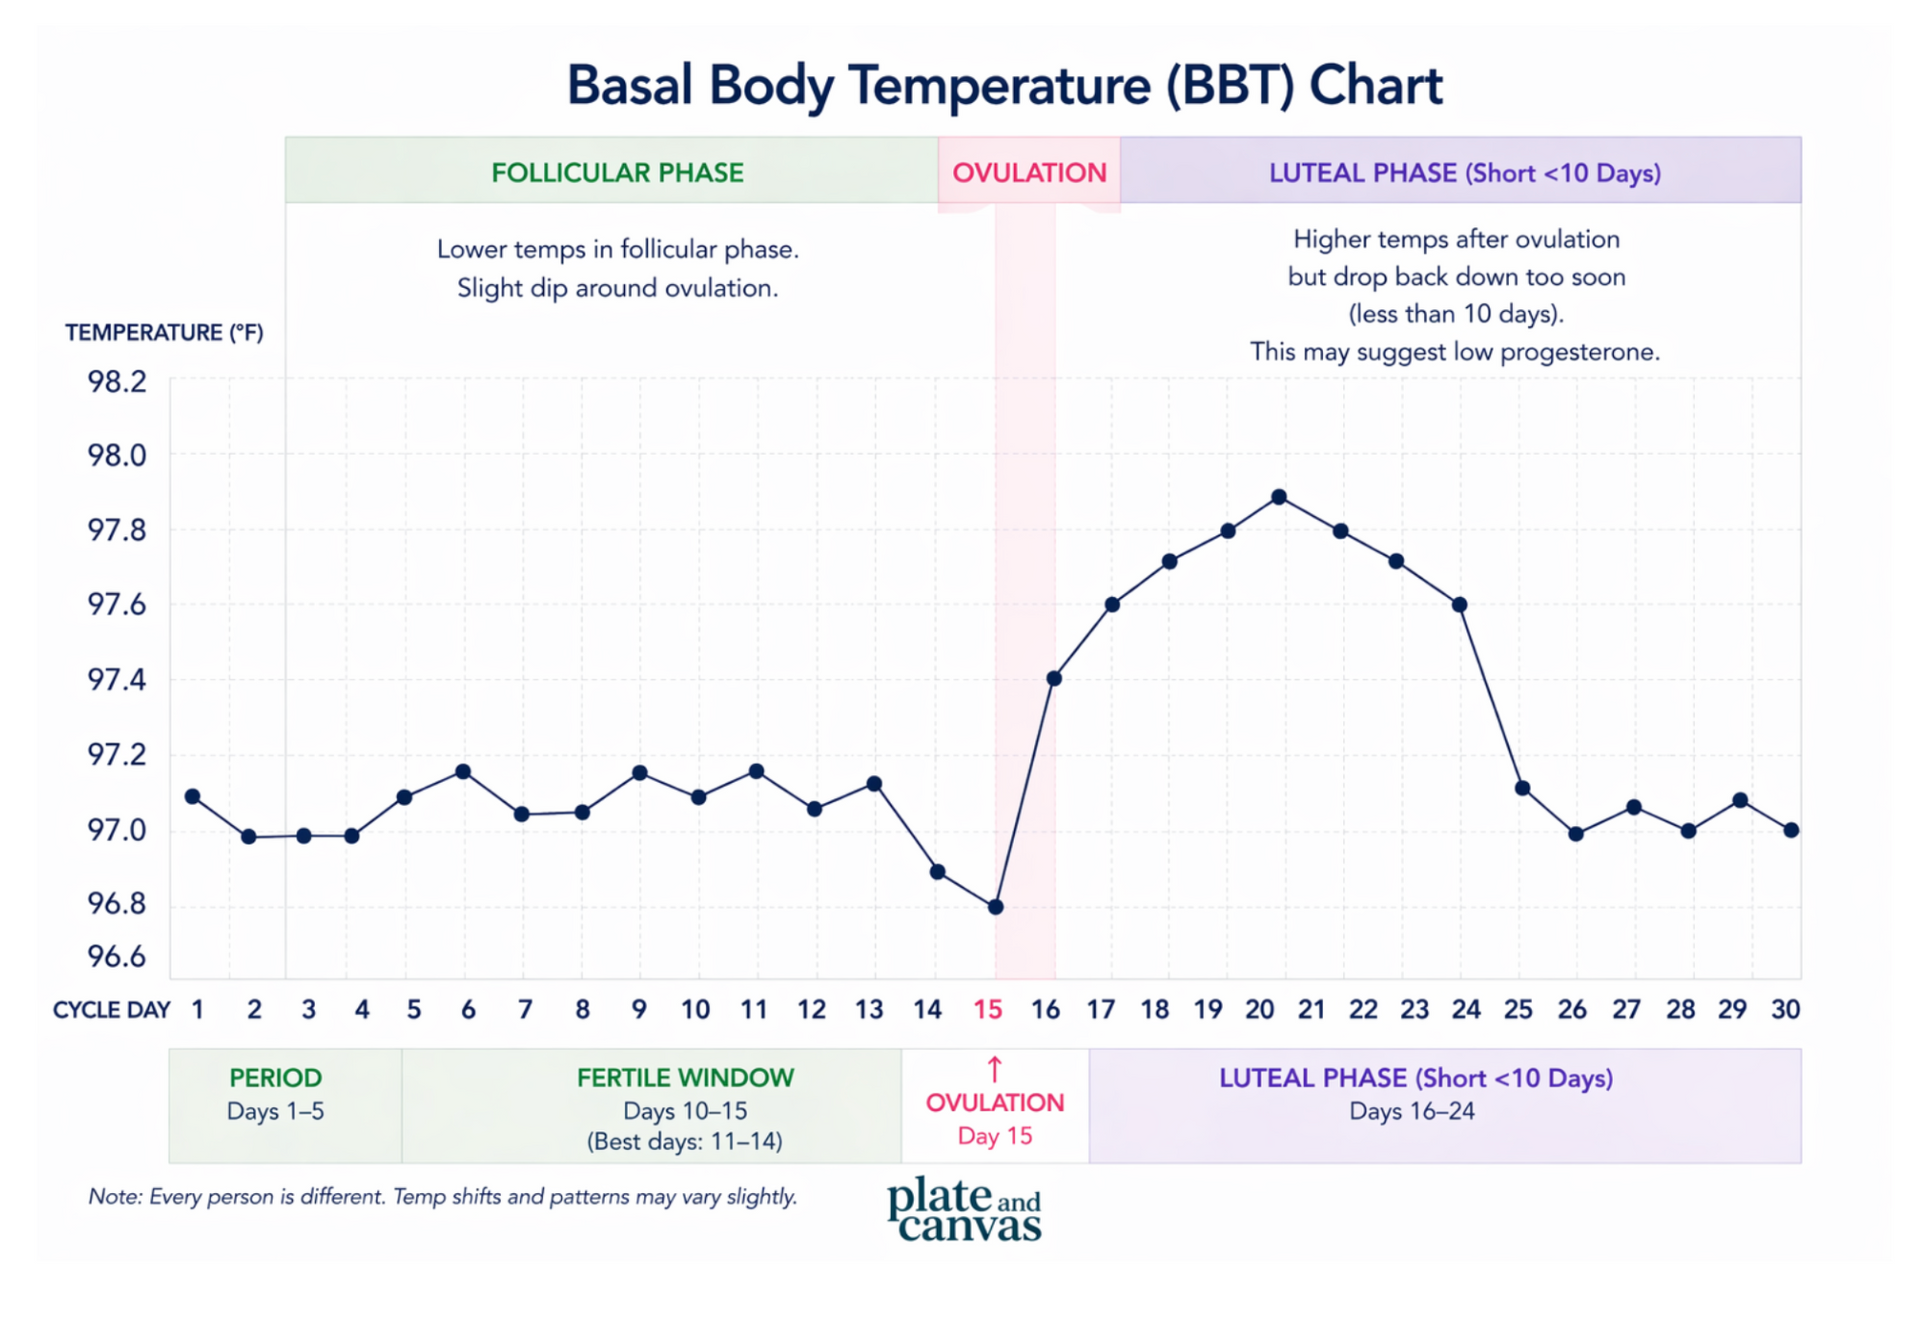
Short Luteal Phase (<10 Days)
Suggests low progesterone.
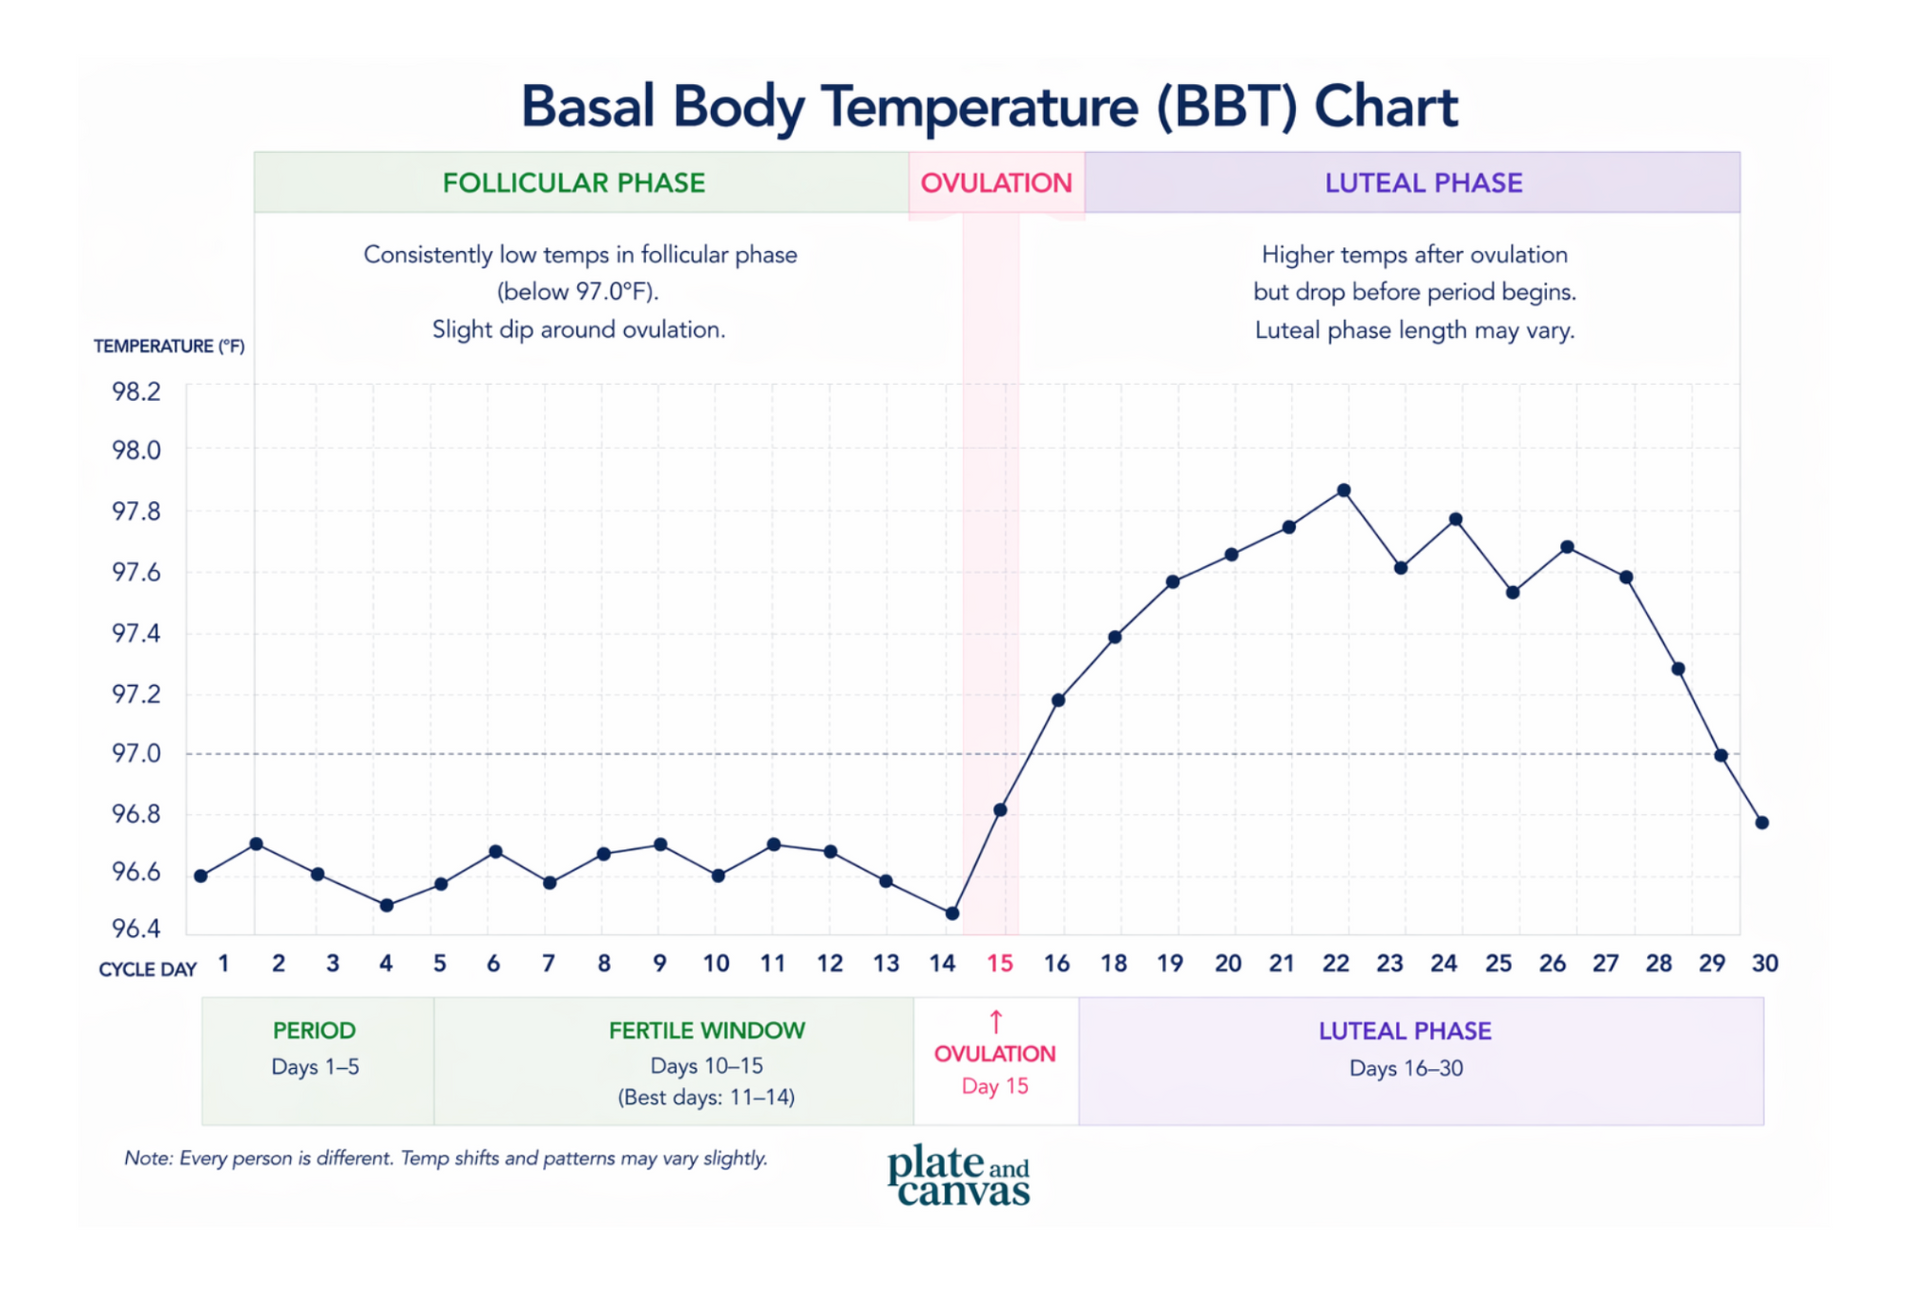
Consistently Low Follicular Temps (below 97°F)
Linked to thyroid issues like hypothyroidism, especially with symptoms (fatigue, hair thinning, weight gain, constipation, etc.)
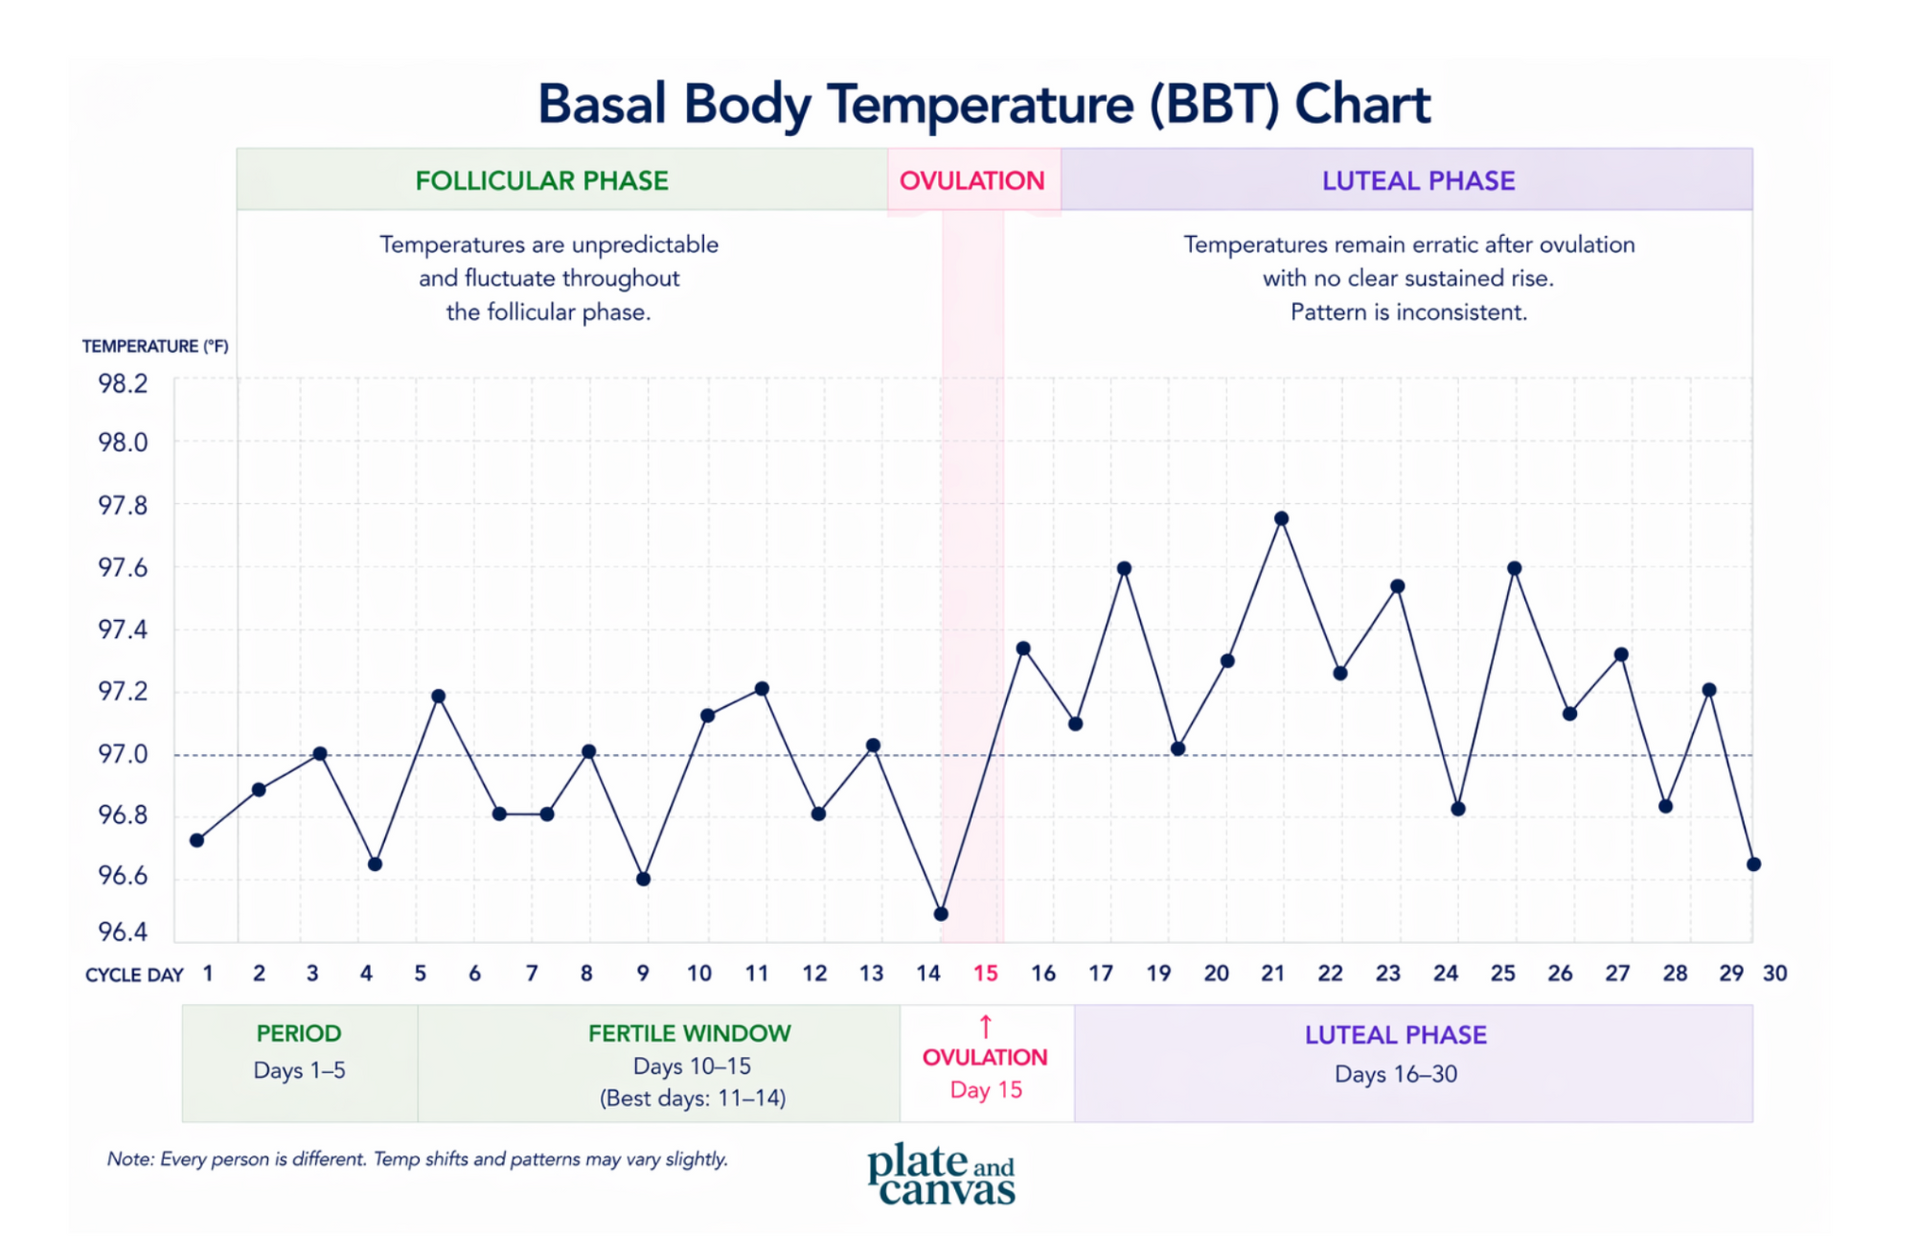
Erratic Temperatures
Often related to poor sleep, stress, blood sugar swings, illness, or inconsistent timing.
Sustained Temperature Rise (>18 days)
An early pregnancy sign due to ongoing progesterone production (which helps support the pregnancy).
Printable Basal Body Temperature Chart: What to Look For
Apps are a popular way to track both your BBT and symptoms throughout your cycle.
If you prefer pen and paper, a printable BBT chart works just as well as an app. We love an excuse to take a break from our phones!
Look for a chart that includes:
- Cycle day column
- Space for daily temperature
- A clear visual grid
- Optional: symptom tracking
We created a free printable BBT chart you can download
here.
Wearables vs Thermometers: Are Oura Ring or WHOOP Accurate for BBT?
Devices like WHOOP and Oura Ring track overnight skin temperature trends, but they aren’t a substitute for a thermometer.
Here’s the key difference: A basal thermometer measures a single waking temperature.
Wearables measure skin temperature deviation from baseline during sleep.
That’s not the same metric.
Wearables can be helpful for trends, but a basal thermometer is more precise for confirming ovulation.
What BBT Can Show You
BBT is useful if you want to:
- Confirm ovulation
- Learn your cycle length/patterns
- Time intercourse (to get pregnant or avoid pregnancy)
- Understand luteal phase length
If you’ve been tracking for months and see:
- No clear ovulation
- Short luteal phases
- Irregular cycles
That’s usually a sign you need more than tracking.
BBT can tell you that something is off, but it can’t tell you why.
If you want a deeper understanding of what’s driving your patterns, this is where testing comes in.
We help clients get answers by using bloodwork and other testing to look at:
- Ovulation patterns and hormone levels
- Thyroid levels
- Nutrient status and inflammation
- Adrenal function
- Blood sugars and metabolic health
From there, we build a personalized plan made just for you.
If you’d like to explore what working together would look like, you can schedule a discovery call here to see if it’s a good fit.
Basal Body Temperature (BBT) Chart FAQ’s
How accurate is BBT charting?
Studies show BBT charting detects ovulation with 76-88% accuracy in ideal conditions.
What are common BBT charting mistakes?
Common BBT charting mistakes include inconsistent timing, getting out of bed before taking your temperature, talking or moving first, relying on wearables, and not allowing enough time for an accurate reading.
What time should I take my basal body temperature?
Immediately upon waking, before getting out of bed, within the same 30–60 minute window daily. Avoid sitting up, talking, drinking water, even checking your phone, until afterwards.
Can an Oura Ring replace a basal thermometer?
Wearables like the Oura Ring track overnight skin temperature trends, but they do not measure true waking basal temperature. A thermometer is more precise for ovulation confirmation.
How much of a rise in BBT confirms ovulation?
A rise of about 0.4–1.0°F, sustained for at least three consecutive days, is typically used to confirm ovulation.
Does lower BBT mean higher estrogen?
Lower basal body temperatures are normal in the follicular phase, when estrogen is higher.
Consistently low temperatures (especially below ~97°F), when paired with symptoms like fatigue, hair thinning, weight gain, or constipation, can sometimes point to issues like low thyroid function.
Where can I find a printable BBT chart?
You can download a free printable basal body temperature chart
here.
Continue Reading